AWS launches CloudWatch Omni for AI agent observability
AWS made CloudWatch Omni generally available, bringing agent traces, output-quality evaluations and experiments into the same service as application telemetry.
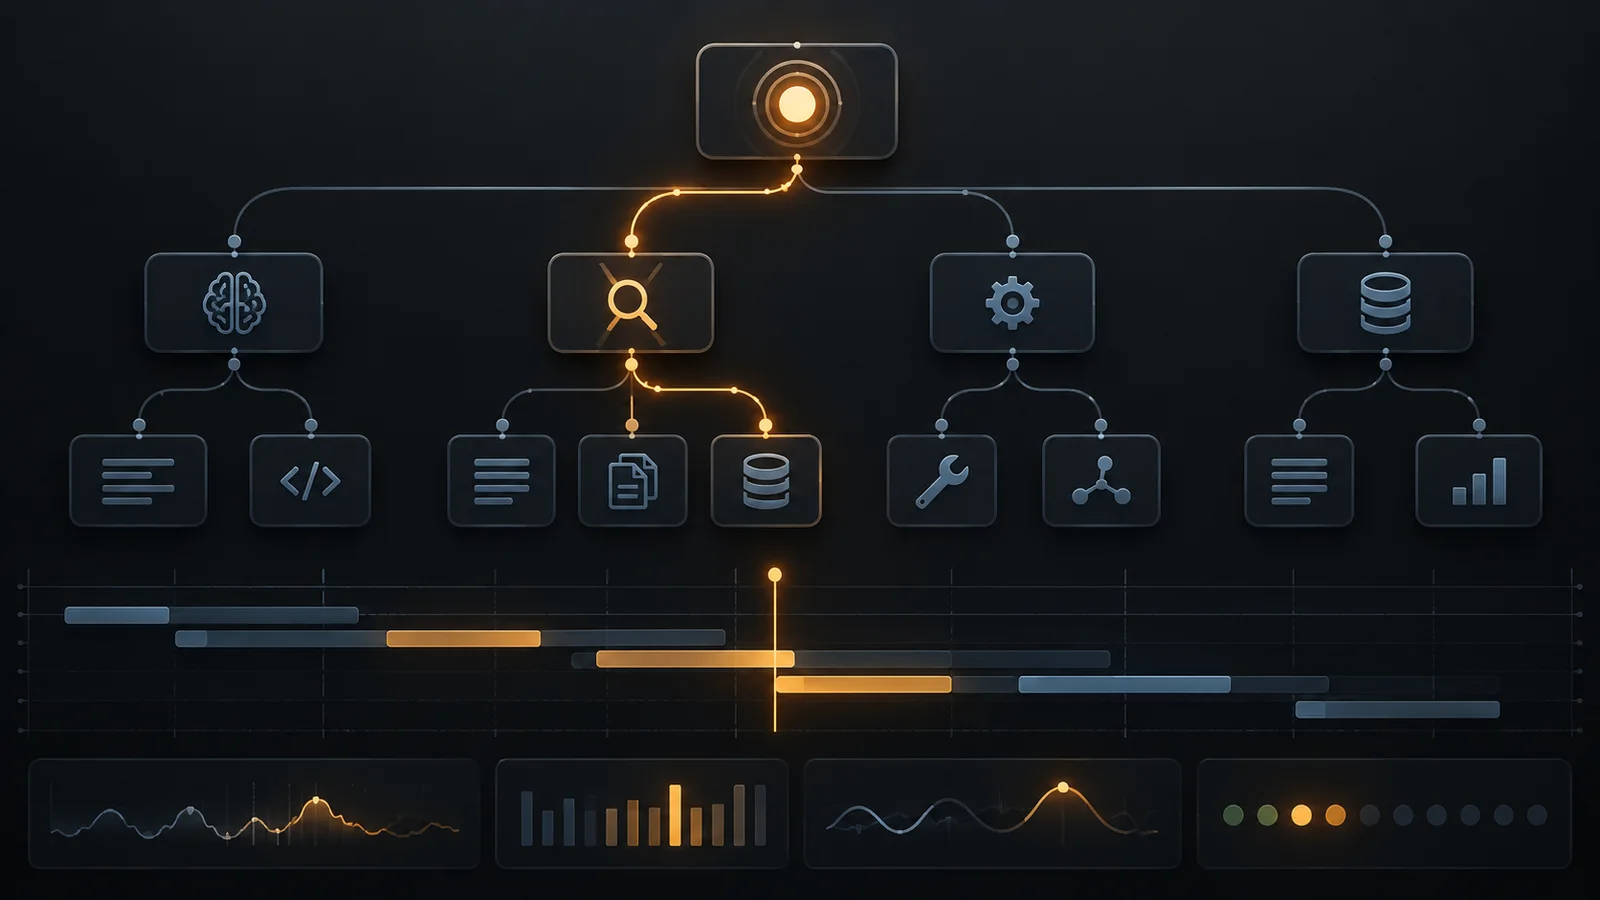
AWS made Amazon CloudWatch Omni generally available on September 22, expanding CloudWatch beyond conventional application health monitoring to trace and evaluate AI-agent behavior. The service records prompts, model invocations, retrievals and tool calls alongside application telemetry, so teams can investigate operational failures and unreliable agent outputs in one place.
Omni extends latency and error monitoring with output-quality evaluation. Those operational metrics can show whether a request completed and how long it took, but not whether an agent produced a coherent, helpful or faithful answer, selected the right tool or routed a request correctly. AWS says Omni includes 17 built-in evaluators for those quality measures while retaining the logs, metrics, traces and alarms used to monitor applications.
A trace of each agent run
Omni represents an agent run as a trace with nested spans for its individual steps. Trace Explorer lays out inputs and outputs, token usage and latency for model calls, retrievals and tool use on a structured timeline. AWS says this view helps teams connect a problematic final response to the step that produced it instead of relying only on an overall success status or response time.
The CloudWatch agent-monitoring documentation describes an evaluation-driven debugging loop built around the same production traces. Teams can convert traces into datasets, test different prompts or configurations, run experiments against agent variants and score the results. Saved datasets and benchmarks can then be rerun after changes to prompts or agent logic to check for regressions.
That work spans two connected surfaces. An IDE extension supports instrumentation, prompt work, tests and experiments during development. A web interface provides production fleet views, traces, monitoring and evaluations. AWS says both surfaces use the same collected data, allowing an investigation that starts with a production trace to continue in a development experiment.
Framework and environment coverage
AWS lists LangChain, LangGraph, CrewAI, the OpenAI SDK, Strands and the Vercel AI SDK among the supported frameworks. Instrumentation is available for Python and TypeScript, and Amazon Bedrock AgentCore agents receive native support.
Omni uses OpenTelemetry concepts for its traces and can monitor instrumented agents running on AWS Lambda, Amazon ECS and Amazon EKS as well as in other clouds, according to AWS. Application connectors can bring telemetry from additional environments into Omni Spaces, where teams can examine it with agent data.
AWS says existing CloudWatch alarms, dashboards, APIs and console workflows continue to operate unchanged. The Omni IDE extension also works locally without an AWS account; connecting it to CloudWatch adds persistent storage, team sharing and production dashboards.
More news
AWS brings managed OAuth consent to Bedrock AgentCore

AWS details SageMaker AI training sessions for custom model loops

Anthropic opens Claude Duet preview to US Pro and Max users