AWS adds cross-layer GPU diagnostics to SageMaker HyperPod
AWS added enhanced observability to SageMaker HyperPod, giving EKS and Slurm training clusters default health telemetry plus opt-in advanced GPU, host and network metrics.
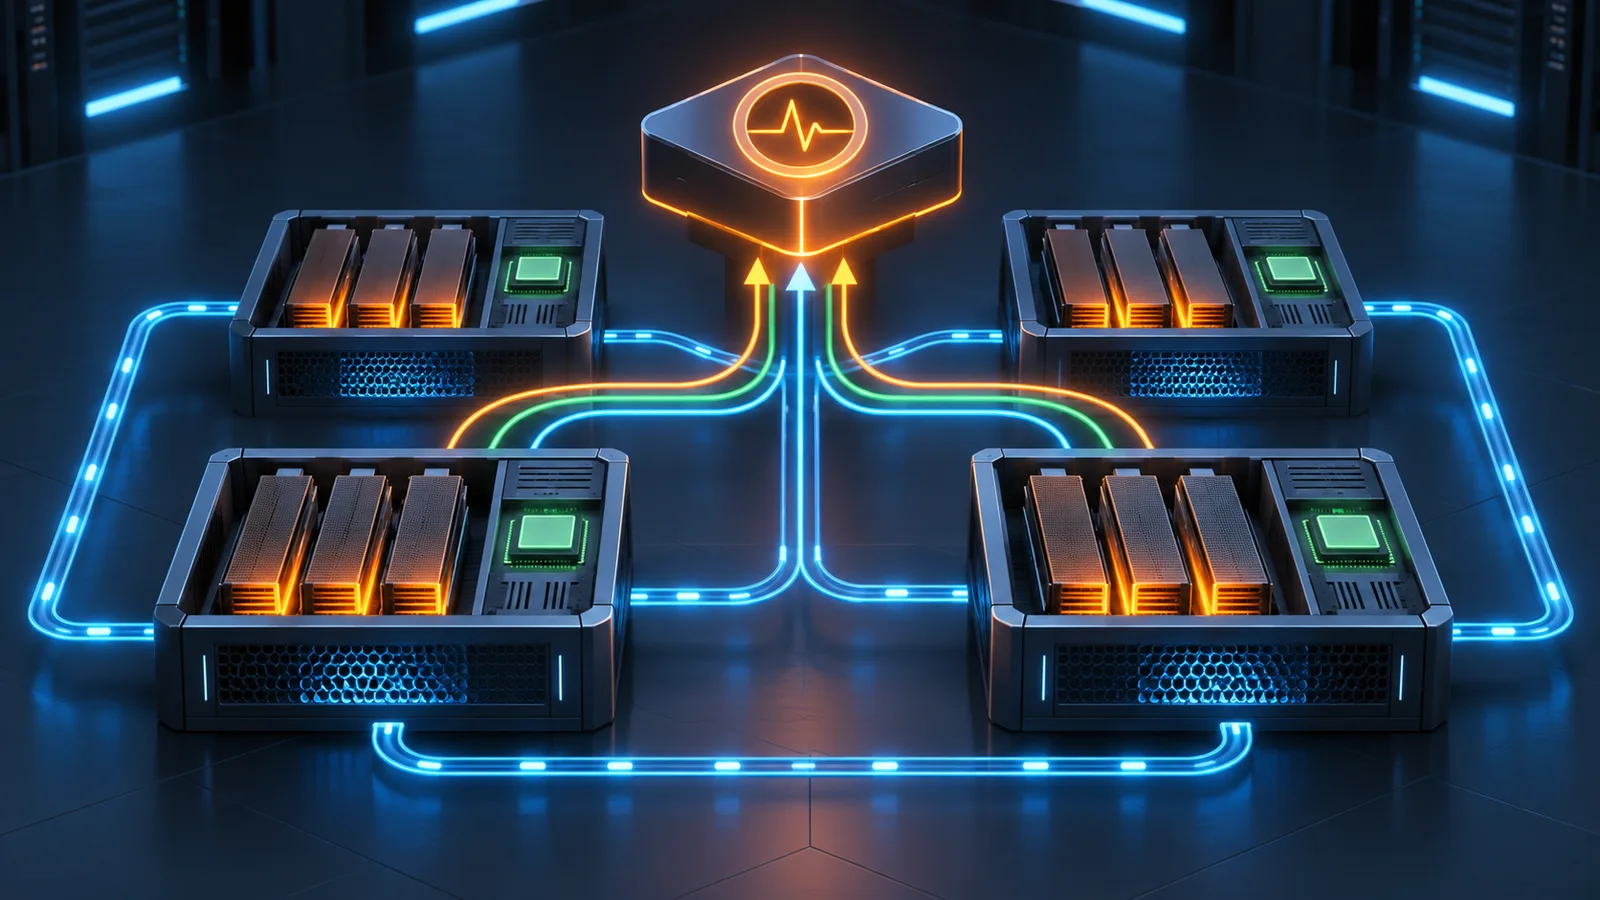
AWS introduced enhanced observability for Amazon SageMaker HyperPod, adding managed diagnostics for GPU training jobs on Amazon EKS and Slurm clusters. The update lets operators compare GPUs within a job and trace detected faults to a cluster, node, accelerator and distributed-training rank. It expands AWS’s HyperPod tooling for EKS and Slurm training operations with telemetry spanning accelerators, hosts, workloads and networks.
By default, telemetry covers cluster health, CPU, disk and operating-system use, GPU utilization and temperature, and per-job resource consumption. AWS says those metrics are collected every 30 seconds and use about 1% to 2% of CPU capacity and 250 MB to 300 MB of memory. The company’s cluster-metrics reference separately lists cluster, instance and limited accelerator metrics as enabled by default.
The setup path determines how observability is enabled. HyperPod’s quick setup enables observability without an option to disable it. Custom setup selects observability by default but lets customers choose metric categories and advanced telemetry. AWS delivers the capability as an EKS add-on or a Slurm cluster extension; the AWS CLI reference says the Slurm extension requires a HyperPod cluster using Continuous node provisioning.
Advanced telemetry remains opt-in. It includes the full node exporter suite, all NVIDIA Data Center GPU Manager and AWS Neuron metrics, and Elastic Fabric Adapter network data covering throughput, packet drops, retransmissions and errors. AWS says enabling it increases the volume sent to the selected metric store and therefore affects cost. The company says small jobs on small clusters may not need that detail, while longer jobs on larger clusters can benefit from the added history. AWS has not published a HyperPod-specific example comparing the two configurations; actual charges depend on enabled metric volume, the selected store, cluster scale and Region. CloudWatch billing guidance says custom metrics and detailed monitoring can incur charges based on transmitted metrics.
Customers can send metrics to Amazon CloudWatch, now the default, or Amazon Managed Service for Prometheus. AWS says Prometheus was previously the only option and describes CloudWatch as less expensive and more tightly integrated with the SageMaker console. Those comparisons are AWS claims rather than independent measurements.
At the job level, HyperPod uses CloudWatch DetectGroupOutliers to compare GPUs participating in the same training job. It checks utilization, memory use, temperature, power draw and streaming-multiprocessor clock frequency, then flags devices that diverge from the group. Static rules also detect GPU ECC memory errors, XID faults and accelerator failures; EFA degradation, drops and retransmissions; clock throttling; and overheating.
Console and dashboard views span cluster, hardware, workload and network dimensions, including per-job EFA, GPU, CPU and memory use. AWS says the feature is available in every AWS Region where SageMaker HyperPod is offered.
More news
vLLM adds day-zero support for Inkling 2 Small
Modal joins gVisor maintainers as project moves to CNCF
MHI and Sakura Internet sign memorandum on Japan sovereign-AI infrastructure